15.1 Introduction
The previous chapters have covered a model for understanding what a system is. The coming chapters are about how to build that system.
This chapter presents where these two arcs meet: the web of artifacts that make up a system and record what it is—the system artifacts. This web is a reification of the abstract model in the previous chapters; the making of this web is the work of making the system.
The system artifacts are a (directed) graph. The nodes in the graph are artifacts that record some aspect of the system, such as a component’s implementation or a requirement or a verification result. The edges in the graph record relationships between nodes, such as a “part-of” relationship between two components, or a “satisfies” relationship between a specification and a design.
The graph contains all the information about the system, as discussed in the previous chapters. It starts with one or more project ideas. These ideas lead to stakeholders and to purposes and constraints. These flow to nodes making up the concept, and from there onwards to implementations and verification evidence.
The development and maintenance or evolution phases of a system-building project are about creating and maintaining this structure. The graph does not spring into existence fully formed; nor is it build in one sweep from the top (idea) to the bottom (implementation). The work starts at the top of the graph with the ideas and stakeholders, with the rest of the structure unknown at the start. People explore downward in multiple threads. Some threads progress deeper than others at any given time. Some threads explore in one direction, find that they have gone in an unhelpful direction and start over in a different direction. Most nodes start out simple, and are added to and corrected many times as the team explores the graph.
The business of making a system well is, then, about starting from the basic idea and, first, exploring and building the structure of system artifacts efficiently; and second, building a structure with good form. Efficiently means using as little time and other resources as possible to build the structure; this implies using resources concurrently and minimizing the amount of work that is re-done (because of false starts or poor workmanship). Good form means that the structure accurately reflects stakeholder objectives and constraints; the system meets those while avoiding other features that are not about customer needs; and the graph accurately reflects the derivation from objectives to implementation. A good system artifact graph will contain all the information people need, but not too much more.
In the next part, I will discuss how one goes about making a system, which amounts to organizing how the team builds this structure in an organized way, without losing track of what they are doing.
15.2 Structure of artifacts
The graph of system artifacts contains all of the information about a system—its purpose, structure, implementation, and why all of that is the way it is (the rationale).
The graph has many types of nodes, including:
- Ideas;
- Stakeholders;
- Purposes, objectives, constraints;
- Concepts;
- Components;
- Specifications, including requirements;
- Designs;
- Analyses;
- Verification methods;
- Implementations; and
- Verification results.
There are many different kinds of edges between these nodes, showing the relations between the artifacts. Some of the most common are:
- Derivation, showing how one thing fills a need or specification in another node;
- Functional and non-functional relations between components, following the definitions in Chapter 12;
- Part-of, showing the component breakdown structure (Section 11.3);
- Evaluation or rationale, recording why some part of the structure has been chosen or why one part is correct; and
- Production, recording that some component is manufactured by the procedure or tools documented in other components.
The graph in Figure 15.1 illustrates a small part of of the upper levels of an example system artifacts graph. The illustration is a simplification; the specification node in the graph, for example, is actually a collection of requirement trees, each of which have derivation relationship to components above and below. Similarly, a design is actually a collection of many things; the illustration leaves out the relationship between the subcomponents within one higher-level component. In practice the graph for even a fairly simple system will have at least tens of thousands of nodes; for complex systems, orders of magnitude more.
This graph of artifacts is what the project builds, bit by bit, over the course of development.

15.2.1 Layering
Looking at the whole artifact structure, as opposed to just particular kinds of information, reveals problems with narrower views.
Most projects and almost all tools organize requirements into a tree. Each component in the breakdown structure has its own set of requirements. These start with the system objectives and constraints, and flow down from one component to another along the component breakdown structure.
In isolation, this structure is missing essential information about the mapping of requirements on component to the requirements on its children , , …, . The set of implicitly encodes how is decomposed into subcomponents. By itself, this leaves out the roles of each subcomponent within and the relationships between the subcomponents. The requirements on derive only in part from the requirements on ; they depend equally on the role that plays within the larger component.
Concretely, consider a spacecraft electrical power system (EPS). The EPS has many requirements, such as being able to provide some minimum wattage to other spacecraft subsystems over the course of the average orbit, being able to passivate (permanently shut down) the EPS, to control which subsystems are powered on or not, and so on. The EPS is built from several components: solar cells that generate electricity, a battery to store the generated energy, a power distribution unit (PDU) that switches where electricity is going, and others.
The passivation requirement, which comes from regulation requiring all energy sources in a spacecraft to be fully and permanently de-energized when the mission ends, must be implemented by those subcomponents. This means that the battery must be drained to zero charge and the EPS must be placed in a mode in which it will never afterward provide any power to any other spacecraft subsystem. This includes the battery never being recharged. Figure 15.2 shows a set of requirements that encode this.
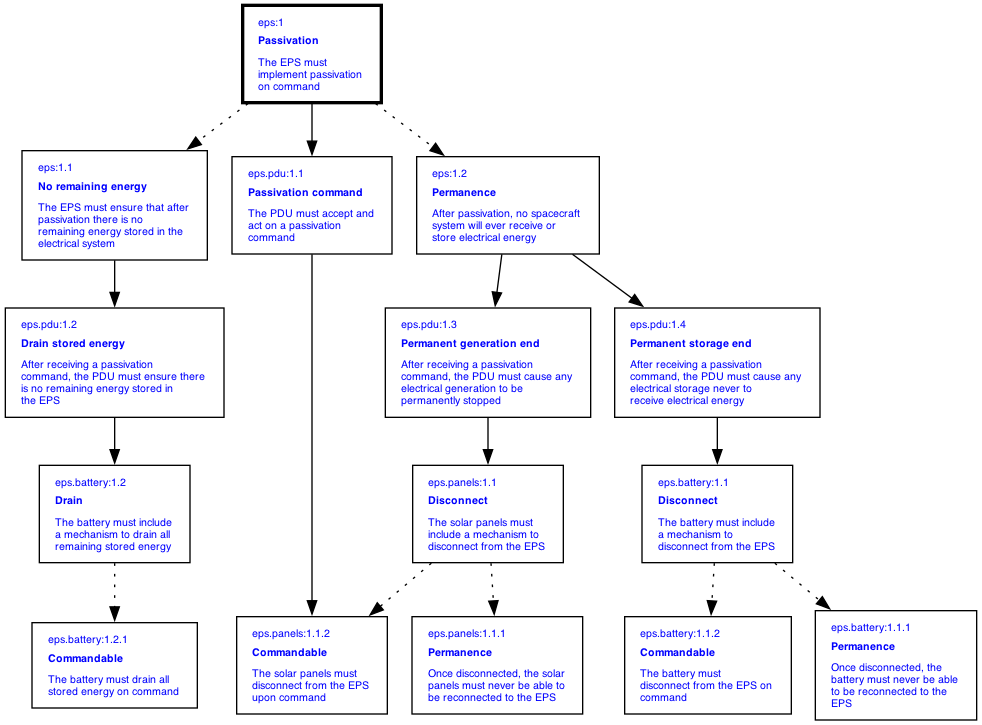
One way to meet the passivation requirement would be to add two features: fuses between the solar panels and the PDU and between the battery and PDU, which when blown would permanently disconnect them; and a mechanism to drain the battery, perhaps by connecting it to a circuit with a resistor that will dissipate any stored energy.
In the requirements flow-down above, there are design decisions hidden in the requirements tree: where and how these functions will be implemented. The disconnection fuses might be implemented as part of the PDU or as part of the solar panels and battery; the design decision was to assign these functions to the solar panels and battery rather than having them within the PDU. Similarly, the function to drain the battery could be implemented in the battery or in something else attached to the PDU. The hidden decision was to assign that function to the battery.
In fact requirements (or specification) and design (in the component breakdown, and the way high-level components are decomposed); they form alternating layers and one cannot be correctly understood without the other. A design records how a component will be made up of subcomponents, and defines the roles and functions that are allocated to each of the subcomponents. The roles and functions define the purpose for the subcomponent. The requirements placed on the subcomponent are derived from the requirements of the higher-level component as transformed through the purpose of the subcomponent.

15.3 Exploration and development
Development of the system is a process of exploration to find and create the contents of the system artifacts graph. This can be thought of as similar to the way the original North American transcontinental railroad was developed (Section 4.7), but with many more choices.
In an idealized situation, where there were no significant uncertainties and where the team had system design patterns to follow, the exploration could start with the idea, proceed to work out the stakeholders and their needs, and then the team could work their way downward step by step until they reached the implementation and verification artifacts at the bottom edge of the graph. I am not aware of any project where this ever happened.
Unfortunately, that kind of steady, unidirectional progress is what too many people expect when they think about the whole mass of information that a project develops. Knowing instinctively that such development doesn’t actually happen, they turn away from organizing the project’s work and focus on building the system implementation artifacts in whatever way they can manage. This is especially true of startups and of small projects.
What gets lost is that the system artifact graph is the end of building a system, not the process for building it. The state of the artifact graph at any moment is a record of what the project has done to that time. The graph is not the plan; the plan is its own artifact (Section 20.6).
The process of making all the parts of the system artifact graph—how the graph grows and changes—is always complex. The process is non-linear and non-monotonic: people will sketch some node in the graph, explore around it, and come back to improve the sketch based on what they have learned. Some people may start working from the top (stakeholders and their needs) downward, but others may have ideas about how parts of the middle of the graph might be structured, and work from the middle out. When there are choices for how some component might be structured, the team explores multiple tentative options, creating multiple parts of the graph, before selecting one of the options and removing the other tentative parts.
The challenge for a team is to develop the graph efficiently and correctly, while allowing for the necessary complexity of working in non-linear ways.
There are two goals for developing the graph efficiently by not wasting resources. The first goal is to minimize errors and rework. If someone develops a component design that does not meet its specification, or an implementation with bugs, then at least some of that effort has been wasted and more effort will be spent fixing the problems. Rework also happens when two people perform duplicate work when only one is needed. The second goal is to keep all the team working without stalling waiting for someone else to complete something. The time someone spends waiting without being able to do useful work on the project is time lost. Organizing the work to maximize potential concurrency can help achieve this second goal.
There are other techniques that keep a project moving quickly, such as assigning work to the person best able to do it. These are in addition to the business of exploring to find the system artifact graph; they are covered in Chapter 69.
While a system is being developed, parts of the system artifact graph will be uncertain. Some parts will still be empty, waiting for someone to start working them out. Some nodes will be incomplete, needing more detail or to be checked for correctness. There may be components that have been specified but for which no feasible design yet exists. The overall process of developing a system is one of driving these uncertainties down to zero (which only happens when the last implementation completes verification and the system is done).
Any time someone is working on something that depends on something that is uncertain, there is a risk that the work they do will have to be redone. The greater the uncertainty, the greater the likelihood of rework. This suggests that the development should proceed cautiously from highly certain parts to less certain ones, and not moving onward until uncertainty has been worked down. Unfortunately this does not work: high-level decisions are often tentative, depending on whether something at a lower level works out. For example, one might decide that the electrical power system from the previous section should include a battery, solar panels, and a power distribution unit. Whether this decision works out will depend on whether battery and solar panel components are available. If they aren’t, or if the available components are too heavy or don’t produce enough power, then that initial design would have to be revisited. At the same time, the decision to use a battery and solar panels for a spacecraft operating in Earth orbit is probably feasible—that is, there is only moderate uncertainty—and so it is reasonable to move forward tentatively with that approach. As I will discuss in Chapter 65, I would then plan to investigate whether there are appropriate solar panels and battery available as next steps.
The final structure of the system artifacts graph should be correct. Some of what makes it correct:
- Every node in the graph has a path (trace) from some stakeholder objective or constraint to that node, except for the top-level ideas and stakeholder definitions. This implies that everything in the graph is there for a documented reason.
- As a corollary, there are no nodes that do not have such a path. A node without such a path is either not there to meet a stakeholder need and is thus excess that could be removed, or it does meet a stakeholder need and the graph is missing edges.
- Every stakeholder objective and constraint is met by the nodes that can be reached from it.
- The part-of relationships between the nodes that make up components are isomorphic to the component breakdown structure (Section 11.3). The component breakdown structure is directed and acyclic.
- All leaf components in the breakdown structure map to implementations in the system artifacts graph. This means no component is left unimplemented.
- The functional and non-functions relationships between nodes that make up components map one-to-one and onto the graphs of relations between components (Section 12.2).
- Nodes have attached rationales where appropriate, documenting why a part of the structure is the way it is.
The process of exploring and developing the system artifact structure will necessarily involve evaluating alternatives for one part or another. A good final structure will come from having explored enough alternatives to have confidence that good choices were made (even if they were not formally optimal). Information about what alternatives were considered and why the result was chosen should be included in the rationales in the structure.
Finally, a good final system artifact structure is complete to a reasonable level of detail, but does not go overboard. It should contain enough information that people can learn what they need from looking at the graph and reading about its nodes, but without including details that won’t help them understand both what the system is and why it is that way.
15.4 Views
The system artifact graph quickly becomes large and intricately connected. For even modest systems, it becomes more than one person can hold in their mind.
People need tools to help them see the parts of the graph that are relevant to their work, while keeping parts that are not useful to them out of their way. I discussed the idea of views in Chapter 13: the ability to focus on subsets of the system or its associated artifact graph.
There are some common ways people need to be able to view subsets of the information. When they are working on one component, they need to see all the information about that component and all its context (relations, derivations, neighbors, parents). When they are working on the structure—components and relations—they need structural information. When they are working on an emergent behavior that crosses many components, such as a safety or security property, they need to see the affected components and their relations, along with information about how component behaviors at different levels combine to create the emergent behavior. When they are verifying some aspect of part of the system, they need to see what the specification is they are verifying and structural information to help them work out how to verify the aspect—perhaps by building a test that uses component interfaces.
I have found that I often use three kinds of views:
- A view that focuses on one component, showing the specification, design, and implementation of that component as well as its context: the relations it has with other components and the roles it plays in emergent behavior at higher levels.
- A view focused on a set of relations, such as a protocol among a set of components or a collection of physically adjacent components. This is useful for working out how the components work together.
- A view that overlays one hierarchy on another. Most often this shows how some feature flows down through a part of the component breakdown.
15.5 Relation to making a system
The preceding chapters have presented an abstract model for what a system is. This model provides tools for thinking about systems: their purpose, scope, components, and structure.
The coming chapters cover how to build the system. They present a model organized around the tasks people do, in which a team uses tools to create artifacts, and the work is organized by how the project operates.
The system artifacts graph is where these two threads meet. The system artifacts are a reification of a system’s abstract model; they record all the information about a system and include the final implementations that are eventually manufactured and deployed. The system artifacts, therefore, must accurately represent the information in the model. The system artifacts are the object of all the work building the system. The nature of the system artifacts graph constrains how the team organizes itself and its work. In particular, the life cycle and planning that a team adopts are statements of how the team will explore and develop the system artifacts.